Help Contents
Overview
Quick Start Guide
Portfolio Lists
Portfolios
Attributes
Prioritization
Optimization
Bubble Charts
Bar Charts
Ranking Charts
Efficient Frontier Charts
Sensitivity Charts
Percent Normalized Weighted Attribute Bar Chart
Form Overview
This form displays a single stacked bar chart where each attributes' normalized weighted value contribution is graphed as a percentage of the total value score. These charts are useful for comparing relative contributions to total value scores on a project by project basis.
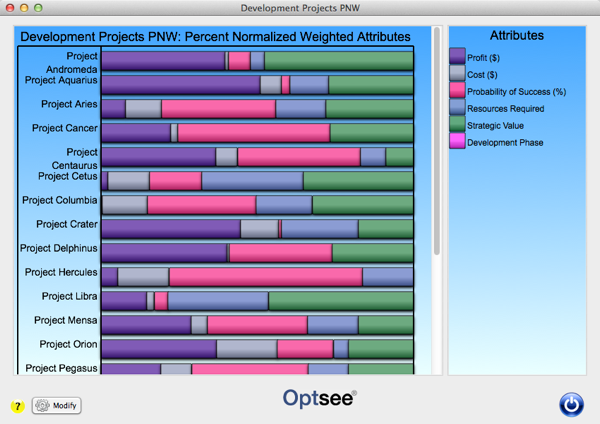
See also: the Normalized Weighted Attribute Stacked Bar Chart Form and the Attribute Data Stacked Bar Chart Form.
The Legend area, on the right side of the window, displays the attribute name next to a small representation of that attributes color/pattern combination.
You can open and modify a attribute by double-clicking on the name in the Legend area. This will cause the corresponding Attribute form to be displayed.
You can also display a bar's variable values by hovering the mouse cursor over an individual bar.
Changes to the chart display are made using the Bar Chart Preferences form, which is opened by clicking on the [Modify] button at the bottom of the bar chart legend area.
You can set the initial size of the bar chart window using the Set Chart Size form and you can adjust the chart size by dragging the lower right corner.
You can also print and export the chart displayed in this form using the standard "Print" and "Export" menu items under the "File" menu.
Note that attributes must be designated as "Active" in the Attribute form to appear in the bar charts. The first 10 Attributes are active by default.
The Bar Chart Display Form Buttons:
[Modify]: Click this button to display the Bar Chart Preferences form.
[Close]: Click on this button to close the Bar Chart form.