Help Contents
Overview
Quick Start Guide
Portfolio Lists
Portfolios
Attributes
Prioritization
Optimization
Bubble Charts
Bar Charts
Ranking Charts
Efficient Frontier Charts
Sensitivity Charts
The Create New Bar Chart form
Form Overview
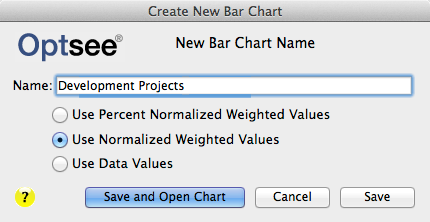
Use the Create New Bar Chart form to create a new Bar Chart. This form displays a blank field for entering the new chart Name. Below the chart name field are three radio buttons for choosing the data you want displayed. Buttons at the bottom allow you to save and open the new chart, save without opening, or cancel and close the form.
Charts are created and opened using the saved bar chart default preferences. You can modify the bar chart using the Bar Chart Preferences form.
Create New Bar Chart Name field:
Enter the Name for the new chart in this field. The chart name must be unique to the portfolio and not exceed 48 characters, including spaces.
The Radio Buttons:
Use Percent Normalized Weighted Values: This will display the attribute data in a stacked bar chart such that each attributes' normalized weighted value contribution is graphed as a percentage of the total value score.
Use Normalized Weighted Values: This will display the attribute data in a stacked bar chart such that each attributes' normalized weighted value is graphed and the length of the bar represents the total value score.
Use Data Values: This will display the attribute data in a stacked bar chart.
Create New Chart Buttons:
[Save and Open Chart]: Click on this button to save and display the new Bar Chart. This button is disabled until a name has been added to the Chart Name field.
[Save]: Click on this button to save, but not display, the new Bar chart. This button is disabled until a name has been added to the Chart Name field.
[Cancel]: Click on this button to close the Create New Bar Chart form without saving the chart.